Industry Report · 2026 Edition

The Emerging Brand’s Playbook for the U.S. Toy and Game Industry

What 25 years of market data, four brand case studies, and hard-won operational experience tell us about where the real opportunity is.

Published by Klugonyx Updated Read time 38 minutes Data through Circana FY2025 (confirmed)

Talk to our team

Key takeaways

  • The U.S. toy and game market grew from roughly $23 billion in 2000 to $30 billion in 2025 on the reported series, or about $10.4 billion in real growth once the 2012 NPD panel reset is adjusted for.
  • The often-quoted 1.9% CAGR is misleading. A 2012 methodology change removed $4 to $5 billion of real demand from the tracked figures without any drop in consumer spending.
  • 2025 delivered +6% growth, the strongest non-pandemic year in more than a decade. Games and Puzzles became the largest supercategory at $4.9 billion, up 37%.
  • Adults are the growth engine. Consumers over 12 account for roughly 25% of U.S. toy and game revenue, and sales to recipients 18 and older grew 18% in H1 2025.
  • Price, not volume, is the emerging brand’s lever. Premium toys priced $30 to $69.99 grew 18% in 2025. Klugonyx toy and game clients average a $68.19 retail price versus a $10.85 market average.
  • Compliance is design work, not paperwork. Industry first-pass test failure rates run 20 to 40%. Klugonyx toy, game, and baby clients run at or below 10% by building CPSIA and ASTM F963 requirements into the design brief.
  • Tooling is the capital cliff. Toy tooling runs $10,000 to $100,000-plus and takes six to twelve weeks per mold. Integrated DFM saves Klugonyx clients $100,000 to $500,000 and three to six months.
  • 2026 is a supply chain year. With 77% of U.S. toys imported from China, 87% of mid-size and 81% of small toy companies reported delayed orders. Central 2026 growth projection: approximately +2%.

Skim the takeaways, then jump to the section you need →

Executive summary

The U.S. toy and game industry is a $30 billion market that grew more than $10 billion in real terms over 26 years, returned to 6% growth in 2025, and now sits roughly 35% above its 2019 baseline. The opportunity for emerging brands is wider than the headline CAGR suggests, but it closes fast for founders who treat safety compliance, design for manufacturability, and factory vetting as finishing steps rather than as the work itself.

The U.S. toy and game industry has a perception problem. A 1.9% compound annual growth rate sounds modest. A market dominated by Mattel, Hasbro, and Lego sounds impenetrable. A category that saw a historic pandemic spike followed by a sharp correction sounds volatile and risky.

None of those readings tell the full story.

Over the last 25 years, the industry grew by more than $10 billion in real terms, proved more resilient than nearly every other consumer category during economic downturns, and quietly developed several high-growth niches that are outpacing the broad market by double digits. The brands winning inside those niches right now are not the giants. They are lean, founder-led companies that identified a specific unmet need, built a well-designed product around it, and got their manufacturing and supply chain right before they ran out of runway.

You can see what that looks like in practice in our toy and game project gallery.

This white paper makes a simple argument: the window for emerging toy and game brands is wider than the headline numbers suggest, but it closes fast for founders who misread the operational requirements of the category. Safety compliance, design for manufacturability, factory vetting, and retail readiness are not finishing steps. They are the work. The brands that treat them that way scale. The brands that treat them as administrative hurdles almost never make it to a second product.

In 2025, the industry confirmed that thesis. Following two years of stagnation, the U.S. toy market returned to 6% growth, its strongest non-pandemic performance in more than a decade, driven not by broad-based volume but by a concentrated bet on premium products, licensed IP, and fandom-driven collectibles. That is a category being shaped by exactly the kind of brands this paper is written for.

What follows is a 26-year look at the market and what it reveals, a map of where the real growth lives today, an honest breakdown of what it takes to enter the category successfully, and four case studies from brands that made it work.

Section 1

Twenty-six years of the U.S. toy and game market

Why is the toy industry’s 1.9% CAGR misleading?

Because a 2012 NPD Group methodology change removed $4 to $5 billion of real sales from the tracked series without any decline in consumer demand. Adjusting for that reset, the market grew roughly $10.4 billion (about 58%) between 2000 and 2025, not the $7 billion (about 30%) the raw series shows.

Ask anyone familiar with the toy and game industry what the long-term growth rate looks like and you will hear some version of the same answer: steady, modest, mature. The 1.9% CAGR from 2000 to 2025 is technically accurate and practically misleading at the same time.

The U.S. toy and game market, as tracked by NPD Group (now Circana), grew from approximately $23 billion in 2000 to $30 billion in 2025. That is $7 billion in net growth on the reported series, or roughly 30% in nominal terms. Adjust for a significant methodology change in 2012, and the real picture is closer to $10.4 billion in growth, or about 58%.

That methodology change matters enough to explain in full, because it created a persistent misunderstanding about the health of the category that affects how people evaluate the opportunity today.

The 2012 panel reset: what really happened

In 2012, NPD Group conducted what it called a “panel reset,” a requalification of how it tracked toy and game sales at the point of sale. The stated goal was to improve accuracy by focusing on retailers with verifiable UPC-based transaction data. The practical effect was that a significant portion of the market dropped out of the reported figures entirely, not because those sales disappeared, but because the outlets where they happened were no longer tracked.

The categories and retail channels that fell out of NPD’s coverage after 2012 included independent hobby shops and specialty toy retailers without UPC-based inventory systems, museum and zoo gift stores, seasonal mall kiosks, small dollar and grocery formats, and theme park vendors. Several product categories were also reclassified into other verticals: hobby-grade R/C vehicles moved to Sporting Goods, large outdoor playsets moved to Outdoor/Sporting Goods, child-targeted tablets and smart speakers moved to Consumer Electronics, and digital game sales shifted to their own tracking category.

The net effect was a reported market decline of approximately $4 to $5 billion between 2011 and 2012, from roughly $21.18 billion to $17 billion. Consumer demand in those categories did not fall. They simply became invisible to the methodology.

For anyone evaluating the toy industry based on the raw CAGR, this is the correction that transforms the story. The post-2012 market is smaller only on paper.
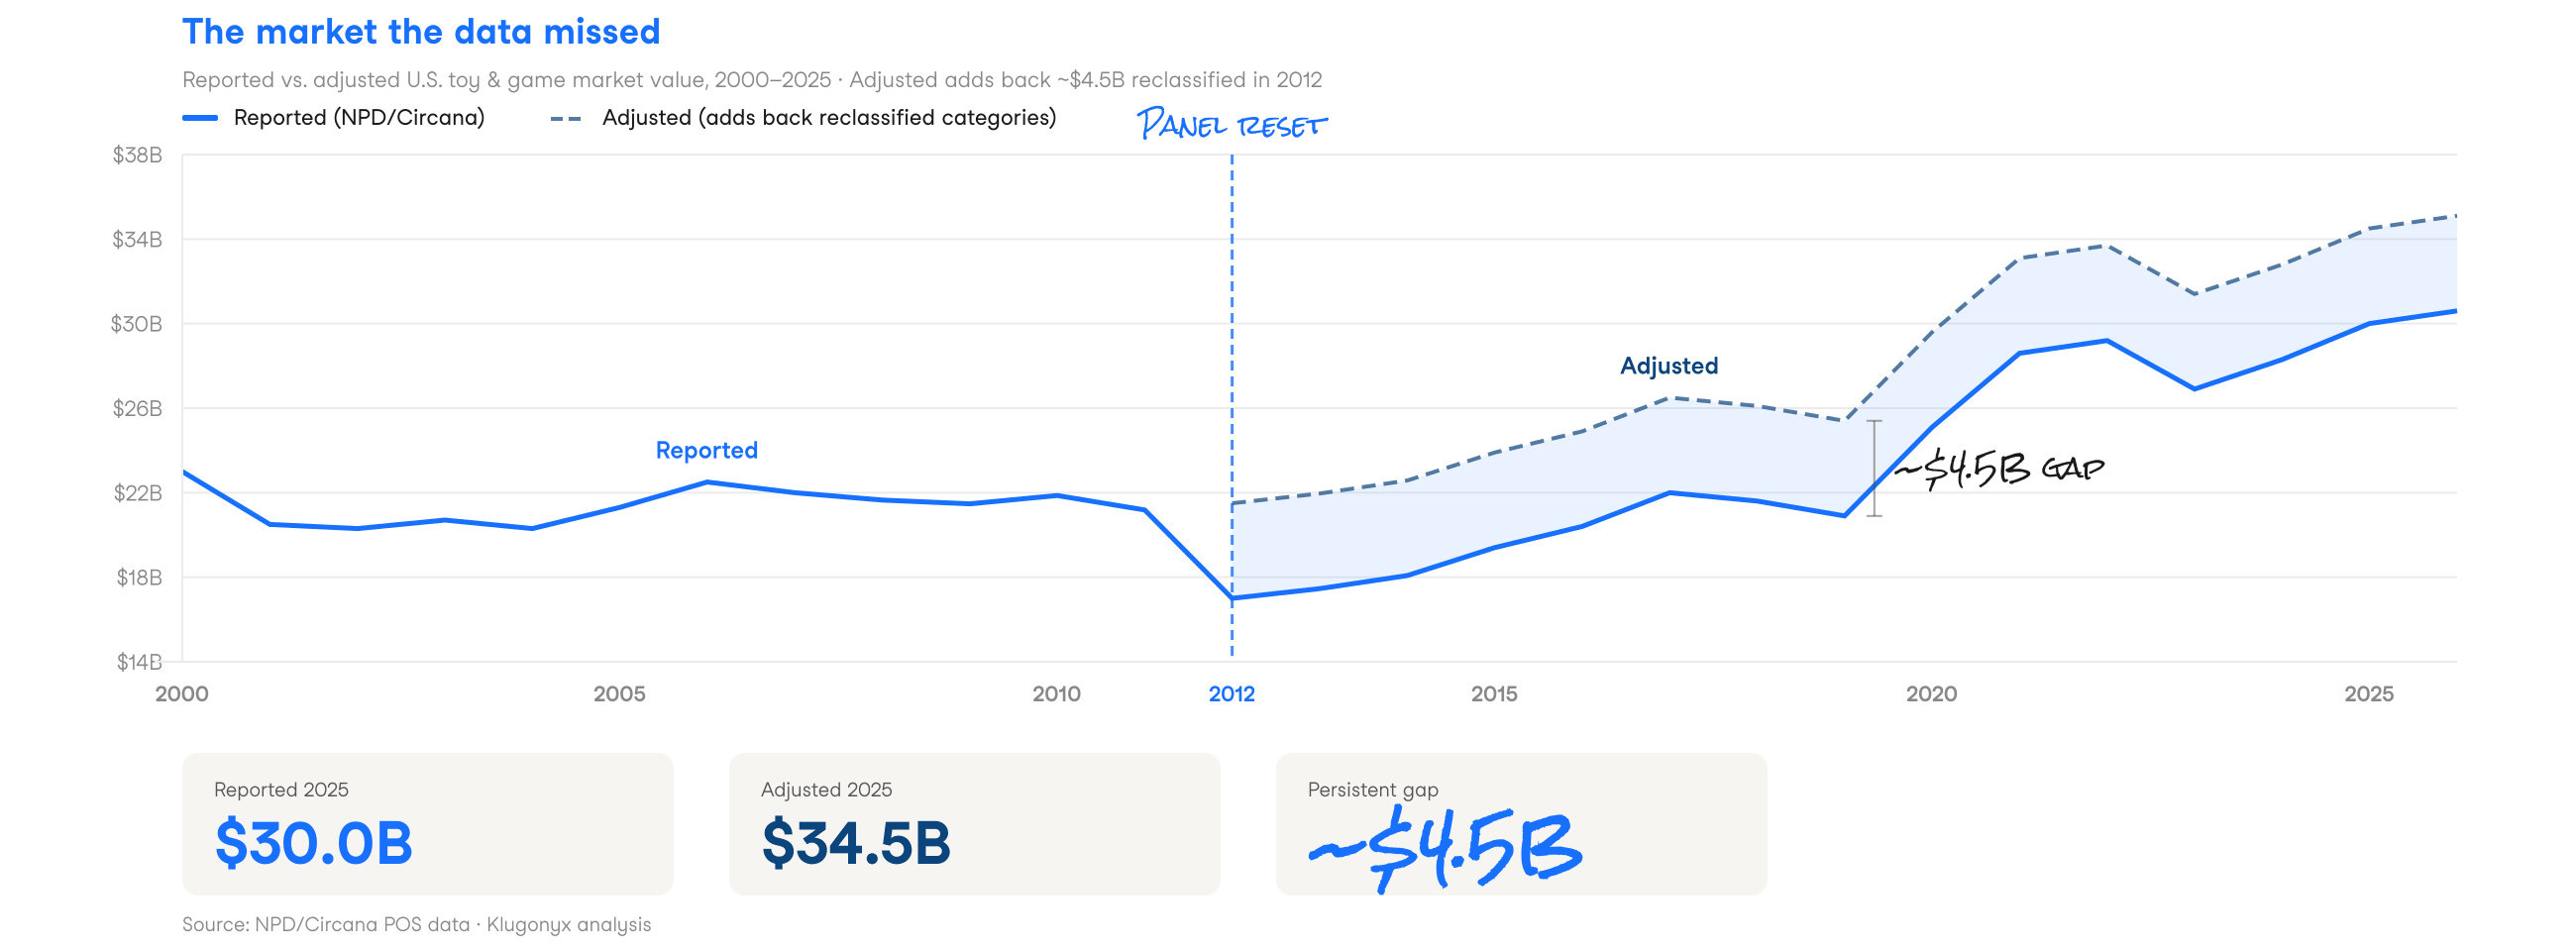
Line chart comparing reported versus adjusted U.S. toy and game market value from 2000 to 2025, showing a persistent gap of about $4.5 billion created by the 2012 NPD panel reset
Figure 1. Reported versus adjusted U.S. toy and game market value, 2000 to 2025. The adjusted series adds back approximately $4.5 billion of categories reclassified out of tracking in 2012. Source: NPD/Circana POS data, Klugonyx analysis.

What the ups and downs actually tell us

Peaks in the toy category are driven by cultural moments (Pokemon, Star Wars, Webkinz, COVID lockdowns) rather than gradual demand growth. Troughs are shallower than in other consumer categories, because parents keep buying toys even when they cut other spending. That combination means high volatility on the upside and structural resilience on the downside.

The 26-year chart is not a flat line. It moves with the culture, with the economy, and occasionally with a single toy that captures the world’s attention for six months. Understanding what drove the peaks and valleys matters more than the average, because it reveals the underlying mechanics of the category.

The peaks are not random. The 2000 high was driven by Pokemon and Star Wars Episode I licensing. The 2006 surge was Webkinz and TMX Elmo. The 2015 spike was Star Wars: The Force Awakens adding an estimated $700 million in licensed product sales. The 2020 explosion at plus 16% happened because 330 million Americans were locked inside with their children and nothing to do. Games and puzzles alone grew 38% that year. And in 2025, Pokemon alone generated $2.5 billion in U.S. toy sales, up 87% year over year, becoming the first single property to exceed $2 billion in a calendar year in at least two decades.

What those peaks share is not luck. They reflect a category that responds faster and more dramatically to cultural moments than almost any other consumer goods vertical. The downside is volatility. The upside is that a well-positioned brand at the right cultural moment can see growth that no amount of marketing spend could manufacture.

The troughs reveal resilience, not fragility. The 2001 to 2003 decline followed 9/11 and the dot-com collapse. The 2008 financial crisis hit the broader economy harder than it hit toys. The 2022 to 2023 correction followed one of the most unusual demand periods in the category’s history. In each case, toys underperformed expectations on the downside relative to other consumer categories. Parents keep buying toys even when they cut other spending. That is structural, not coincidental.

The 26-year timeline: key moments

Sources: NPD/Circana POS data 2000 to 2024; Circana, LLC, February 3, 2026 for confirmed 2025 data; Klugonyx central projection for 2026.
YearWhat happenedDirection
2000Pokemon and Star Wars Episode I licensing lift toy sales to a modern-era high of $23BGrowth
20019/11 and the dot-com bust cause toy sales to drop approximately $3BDecline (-11%)
2002Sales remain flat. Walmart and Toys R Us begin price warsFlat
2003Harry Potter and Bratz help stabilize sales, still down from the 2000 highStabilizing
2004Nintendo DS and PSP launch. Many U.S. toy stores file bankruptcy due to price competitionDecline
2005First “kidult” toy collections emerge (Lego Star Wars, PSP collectables)Growth
2006Webkinz and TMX Elmo drive the hottest holiday toy sales of the decadeGrowth
2007Mass toy recall over lead paint hurts consumer trust and stalls growthDecline
2008Great Recession hits, but toys outperform the wider marketDecline
2009Movie toy licensing drives 25% of toy sales. Building sets and arts and crafts see an uptickGrowth
2010iPad launches but physical building set sales (Lego) boom by 13%Growth
2011Toys R Us enters debt crisis. App stores drive a rise in game sales. Ecommerce takes center stageDecline
2012NPD “panel reset” removes $4 to $5B from tracked figures through methodology change, not real demand declineReporting change
2013Out-of-the-box craft kits and the Rainbow Loom crazeGrowth
2014Frozen toy licensing and educational STEM tablets spark a sales uptickGrowth
2015Star Wars: The Force Awakens adds $700M to toy salesGrowth
2016Hatchimals and film licensing boomGrowth
2017Fidget spinners and blind-bag minis drive a boomGrowth
2018Toys R Us closes all U.S. stores, removing 15% of toy shelf spaceDecline
2019Kidult segment contributes 20% of industry sales in a slow yearFlat
2020COVID lockdown sparks the “play wave.” Total category up 16%, games and puzzles up 38%Growth (+16%)
2021Stimulus payments drive toy and game sales up 13%Growth (+13%)
2022Inflation lifts toy prices and sales stagnateFlat
2023High inflation and interest rates cause a post-pandemic correctionDecline (-8%)
2024Flat growth. Toy sales remain approximately 26% above 2019 levelsFlat
2025Pokemon drives $2.5B in U.S. toy sales (+87% YoY), the first property to crack $2B in a single year in at least two decades. Games and Puzzles emerges as the largest supercategory at $4.9BGrowth (+6%)
2026Solid licensing and collectibles momentum meets significant supply chain uncertainty. China import tariffs drive order delays across mid-size and small brands. A U.S.-China tariff pause in May 2026 provides partial reliefProjected (+2%)

Confirmed 2025 figures: Circana, February 3, 2026. For supply chain strategy in the current tariff environment, see our guide to transitioning manufacturing beyond China.
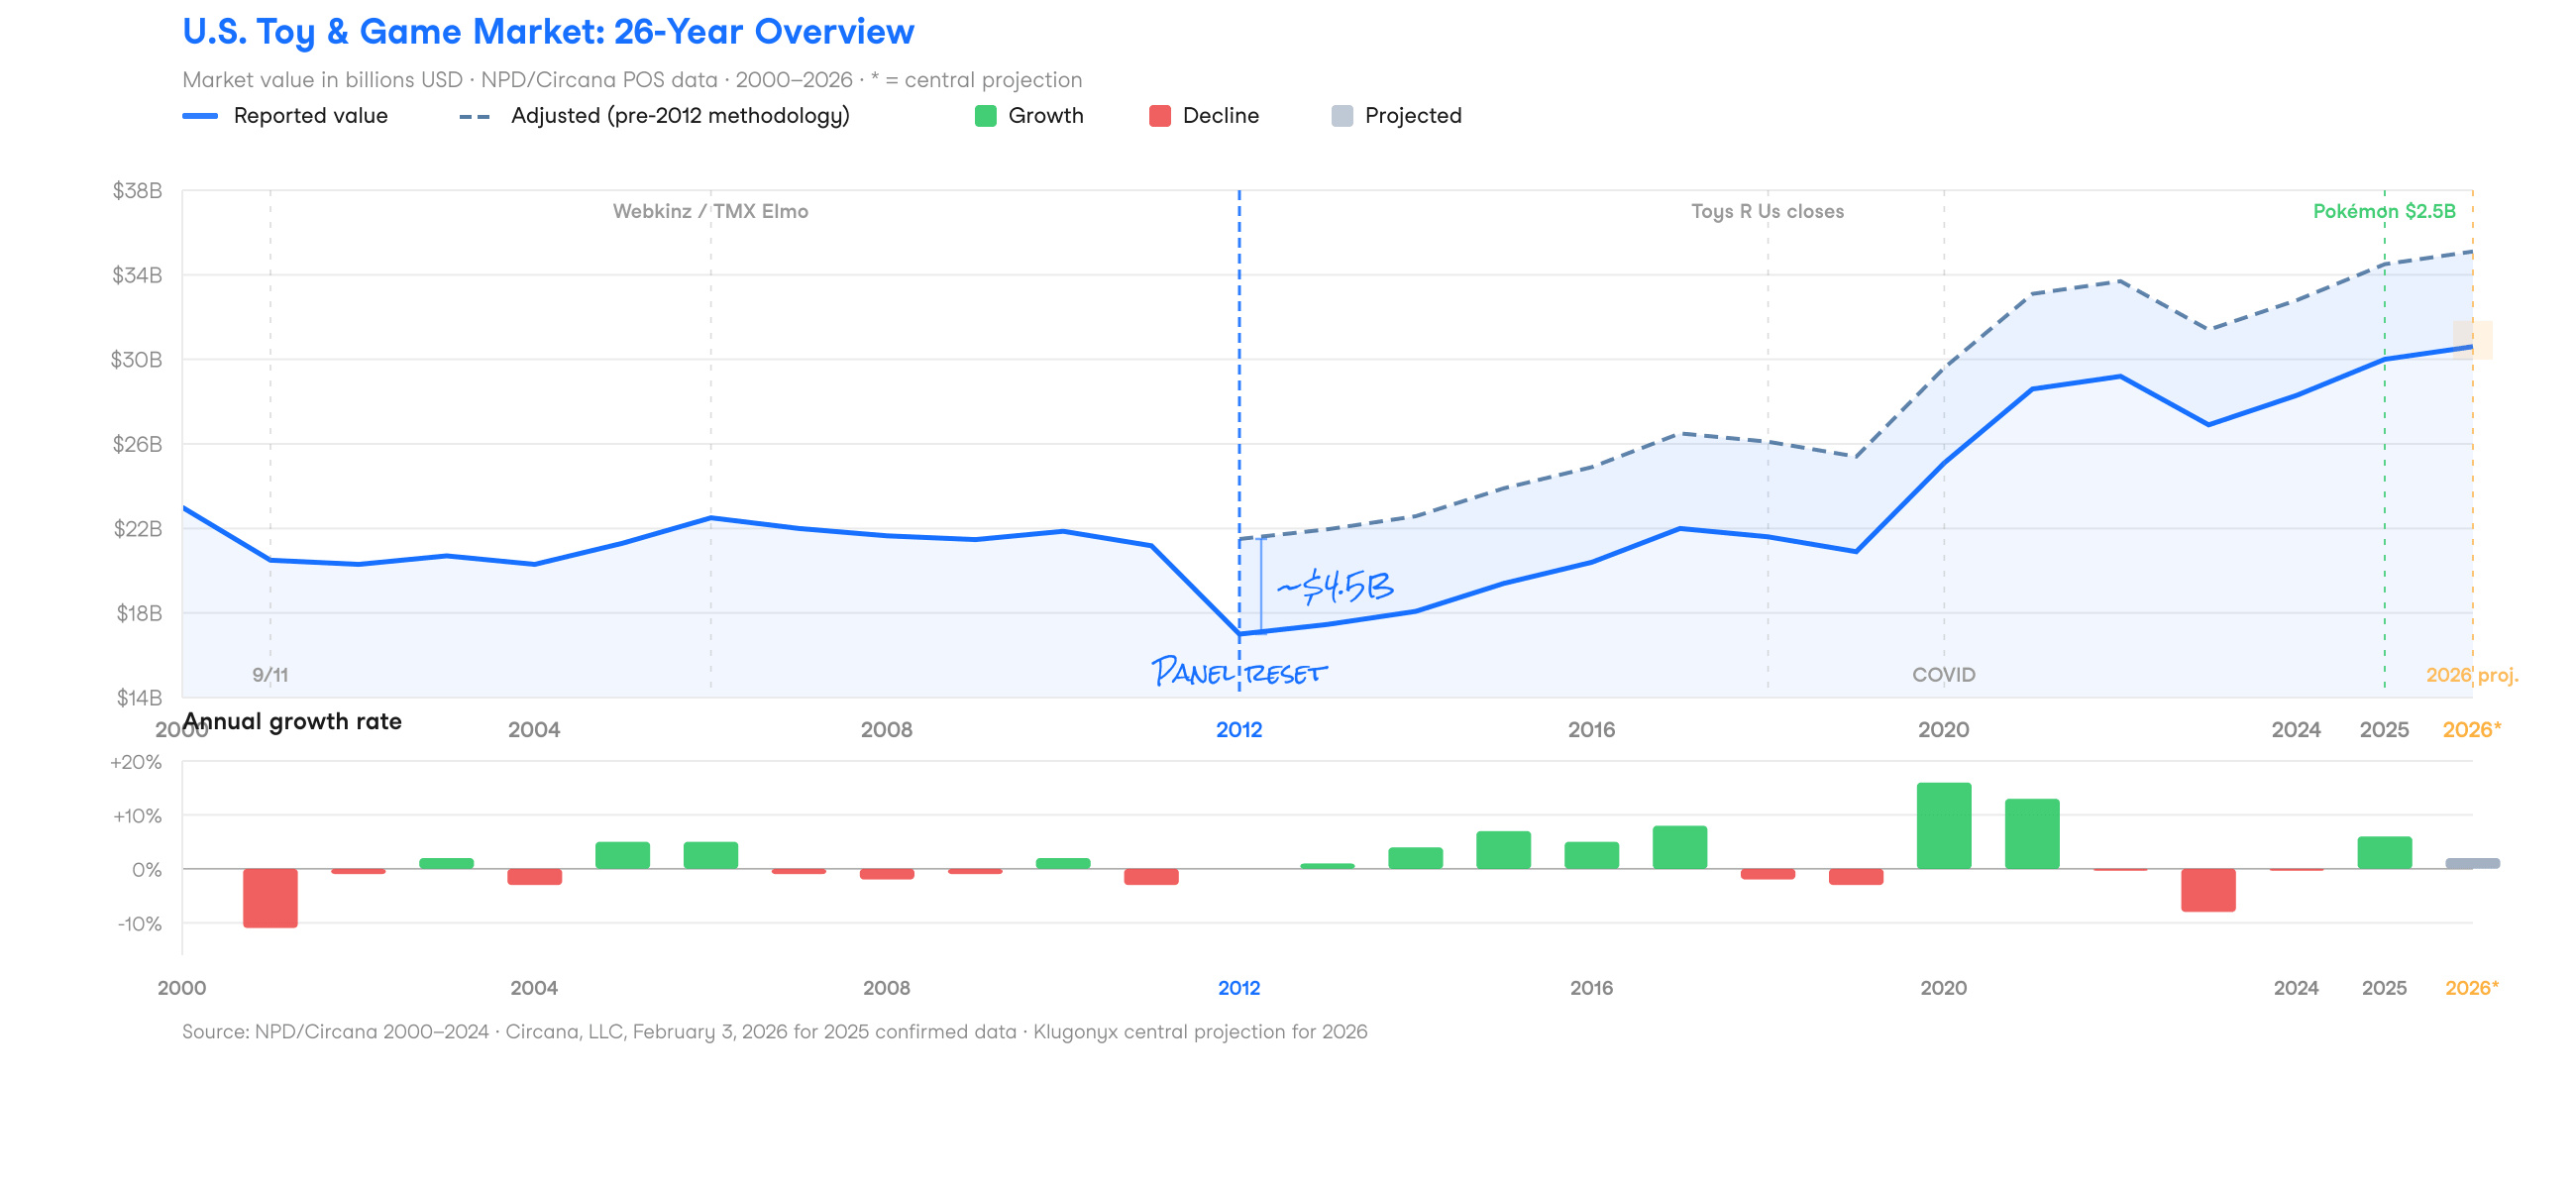
Combined line and bar chart of the U.S. toy and game market from 2000 to 2026 showing reported value, methodology-adjusted value, and annual growth rate by year
Figure 2. U.S. toy and game market, 26-year overview with annual growth rate. Market value in billions USD. Source: NPD/Circana POS data 2000 to 2024; Circana, LLC, February 3, 2026 for confirmed 2025 data; Klugonyx central projection for 2026.

The post-pandemic baseline: the most important number in this document

For an emerging brand evaluating the market today, the right comparison is not the 2020 to 2021 pandemic peak. It is the 2019 pre-pandemic baseline. Toy sales in 2025 sit approximately 35% above 2019 levels on the tracked Circana series.

The category has now demonstrated positive growth through three distinct post-pandemic phases: the 2020 to 2021 surge, the 2022 to 2023 correction, and the 2025 recovery. Each phase has resolved higher than its starting point. That is a category with structural resilience, not a one-time spike that has since normalized away.

2025 confirmed: +6% growth

Total annual dollar sales grew by 6%, average selling price rose 4%, and units sold increased by 3%. Six of 11 supercategories posted dollar growth, led by Games and Puzzles (+37%), Building Sets (+15%), and Explorative and Other Toys (+20%). These three supercategories contributed 92% of all toy industry growth in 2025.

Source: Circana, LLC, February 3, 2026.

2026 projection: +2% central estimate (range: -2% to +4%)

The U.S. toy industry enters 2026 with solid momentum, supported by licensing, collectibles, and a strong content pipeline, but with meaningful uncertainties ahead. While tariffs have not yet materially impacted prices for consumers, their downstream effects remain unpredictable. A U.S.-China tariff pause in May 2026 partially relieves pressure on the 77% of toys imported from China, but the full downstream effects on production schedules and consumer pricing remain unresolved.

Sources: Circana, February 2026; The Toy Association member survey, April 2025.

Section 2

Where the growth actually lives

The headline hides the niche opportunities

Inside the broad toy and game market, several segments are growing at two to five times the overall rate. They share one characteristic: they serve customers the traditional toy industry largely ignored, above all adults buying for themselves.

A 1.9% CAGR is an average. Averages flatten the distribution. Inside the broad toy and game market, several segments are growing at two to five times the overall rate, and those segments share a common characteristic: they serve customers the traditional toy industry largely ignored.

The most important shift in the last five years is demographic, not technological. Birth rates in the United States and most developed markets have been declining steadily. The 0 to 9-year-old cohort, the historical core of the toy market, is shrinking as a share of the population. The toy industry’s response to that reality has reshaped the category in ways that create real opportunity for emerging brands.

The kidult shift: your fastest-growing buyer is not a child

Consumers over the age of 12 now account for approximately 25% of all U.S. toy and game revenue. Sales to recipients aged 18 and older grew 18% in the first half of 2025, nearly evenly split between men and women.

The term “kidult” entered the toy industry’s vocabulary around 2019, but the behavior it describes goes back further. Adults have always bought toys, collectables, and games for themselves. What changed is the scale of it.

That 25% share grew 58% between 2021 and 2022 alone, according to Circana, and the trend accelerated further in 2025 (Circana, H1 2025). Growth in the 9 to 11 age group reached 9% and the 12 to 17 segment grew 6%. The implication is that the toy category’s most reliable growth engine is no longer the 0 to 9-year-old cohort that defined the industry for most of its history. It is adults buying for themselves, and older children buying with a collector’s mindset.

For emerging brands, the kidult segment offers something structurally attractive: buyers with higher disposable income, lower price sensitivity, and stronger loyalty to products that resonate with their identity. A well-designed product at $45 targeting an adult hobbyist in a specific niche outperforms a commodity toy at $12 fighting for shelf space against companies with nine-figure marketing budgets.

The strategic implication is significant. Emerging brands that position in the kidult or collector segment can compete on design quality, brand storytelling, and community rather than on production scale and distribution reach, which are exactly the dimensions where large incumbents have the advantage.

Four high-growth segments worth serious attention

SegmentProjected growthBarrier to entryWhy it matters for emerging brands
Connected and IoT toys24% globally by 2030HighPremium price points and defensible IP, offset by software testing and children’s data privacy requirements
Sustainably made toys13% global CAGR through 2032ModerateHigher production cost, but higher price tolerance among the parents who prioritize it
Plush and emotional wellness6.1% CAGR through 2030LowTikTok can take a product from niche to sellout in days, but the space crowds fast once a format goes viral
Tabletop and analog gamesGrew 37% in 2025 to $4.9BLow to moderateStrong independent retail channel, active enthusiast communities, and a crowdfunding ecosystem for demand validation

Connected and IoT toys

STEM electronics, app-enhanced physical toys, AI voice integration, robotics kits, and augmented reality play experiences represent the category with the highest projected growth and the highest barrier to entry. The connected toy segment is forecast to grow 24% globally by 2030. The compliance complexity is real: software components add layers of testing requirements, and connectivity features bring data privacy regulations into scope for products targeting children.

Our toy and game design page outlines how we handle compliance planning from the first design brief. The premium price points and defensible intellectual property this segment allows make it worth the investment for the right brand.

Sustainably made toys

Consumer demand for toys made with recycled materials, FSC-certified wood, and non-toxic finishes has moved from a marketing claim to a purchasing criterion. The sustainably made toy segment is forecast to grow at a 13% global CAGR through 2032. The production cost is higher, but so is the price tolerance among the parents who prioritize it. The brands that build sustainable sourcing into their supply chain from the beginning will be better positioned than those retrofitting it after the fact.

Plush and emotional wellness toys

Plush has always cycled through boom and bust periods. What is different now is the amplification mechanism. TikTok virality can drive a plush product from niche to sellout in days rather than seasons. Combined with a documented rise in emotional wellness gifting across age groups, the plush segment carries a 6.1% projected CAGR through 2030. The low barrier to entry also means the space gets crowded quickly when a format goes viral, which makes differentiated design and brand identity more important than ever.

Tabletop and analog games

Board game and puzzle sales grew 38% during the 2020 lockdowns and have not fully retreated. Sales remain approximately 70% above 2019 levels. The “put the phone down” and intentional family time movements are durable cultural trends rather than pandemic-specific behaviors. The tabletop category also benefits from a strong independent retail channel, active enthusiast communities, and a robust crowdfunding ecosystem that lets emerging brands validate demand before committing to full production runs.

The 2025 results validated the tabletop and games category’s durability most dramatically. Games and Puzzles emerged as the largest toy supercategory in 2025, generating $4.9 billion in U.S. sales, up 37% year over year, driven primarily by Pokemon trading cards (Circana, February 2026). The category’s growth was not solely a trading card story: the broader shift toward analog, community-oriented play continues to compound.

For emerging brands in the tabletop space, 2025 established that this segment can sustain outsized growth even in a year of broader category normalization. Browse our toy and game project gallery to see examples of the range of products we have brought to market across age groups and play patterns.
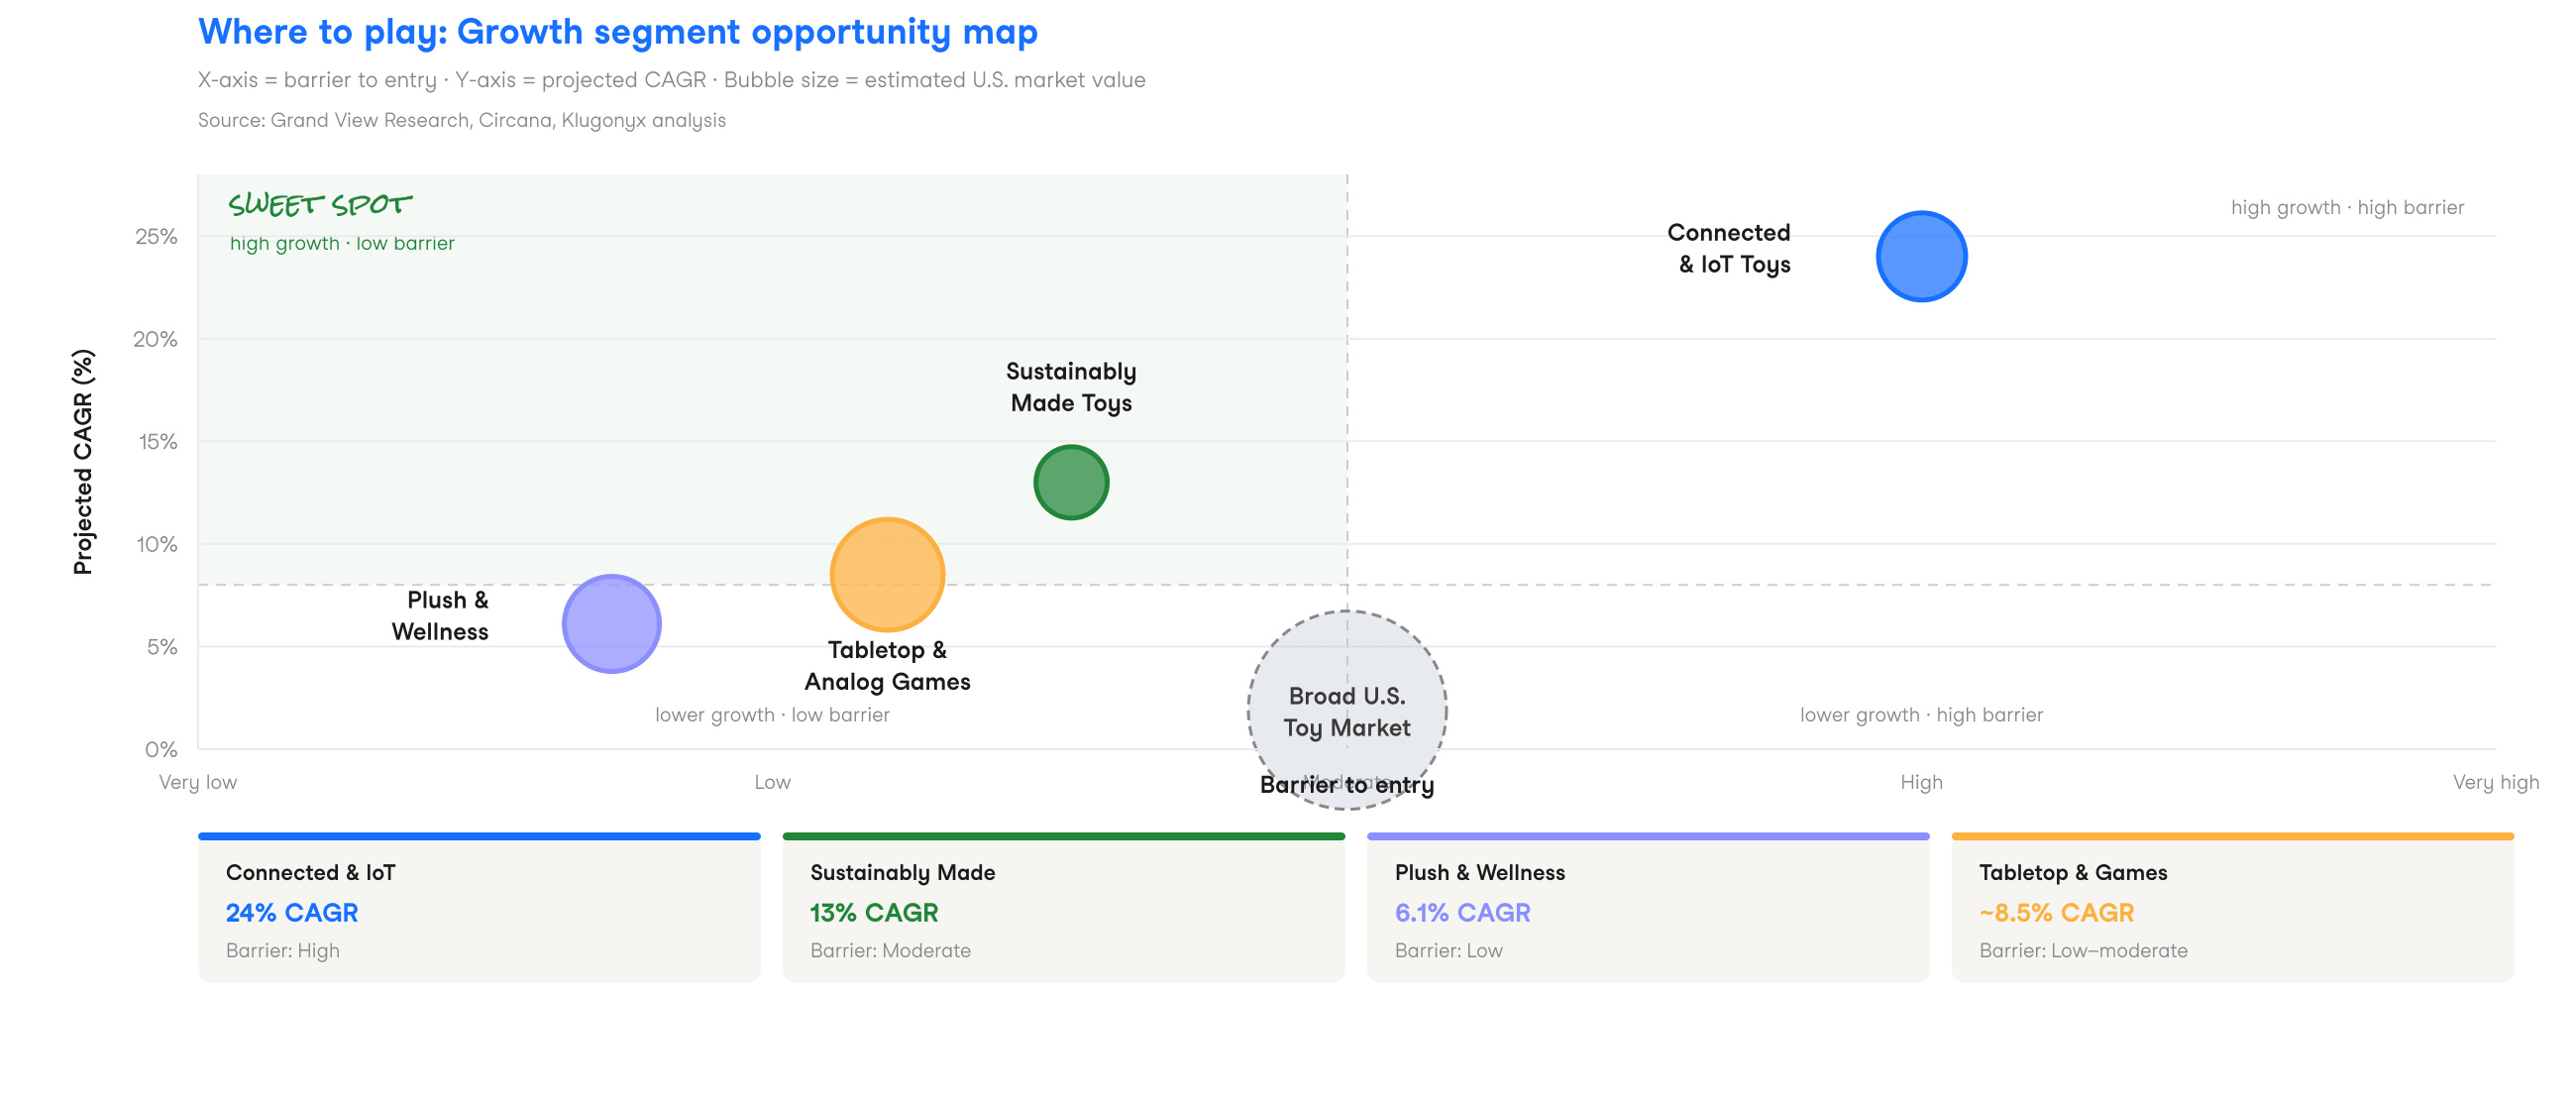
Bubble chart plotting four toy market growth segments by barrier to entry and projected CAGR, identifying sustainably made toys and tabletop games as the high growth, low barrier sweet spot
Figure 3. Growth segment opportunity map. X-axis is barrier to entry, Y-axis is projected CAGR, bubble size is estimated U.S. market value. Source: Grand View Research, Circana, Klugonyx analysis.

The ASP shift: why unit volume is the wrong metric

Average selling price, not unit volume, is now the primary driver of brand health in toys. Premium products priced between $30 and $69.99 grew 18% in 2025, and category ASP rose 4% after three consecutive flat years. That removes one of the biggest structural disadvantages of being a small brand.

For most of the toy industry’s history, winning meant moving more units. Shelf space was won through volume, and volume was won through low prices. That model favored companies with the manufacturing scale to compete at $9.99 or below, which is to say it favored the giants.

The post-pandemic toy market looks different. Premium-positioned products are outperforming their volume equivalents. The 2025 data confirms this structurally (Circana, H1 2025). Consumers did not simply pay more for the same things. They deliberately traded up to products they valued more.

For an emerging brand, this shift removes one of the most significant structural disadvantages of being small. You will never out-manufacture Hasbro. You can out-design them in a niche. You can out-story them with a specific buyer. And if you price accordingly, you can build a healthy margin structure without needing the unit volume that would require a $20 million production budget to achieve.

$10.85U.S. toy market average selling price, 2024, flat for three consecutive prior years (Circana, H1 2024)
$68.19Average retail price point across Klugonyx toy and game client products developed over the last five years
+18%Growth in premium toys priced $30 to $69.99 in 2025

These brands are not competing in the volume-driven, mass-market segment. They are building products that earn their price point through design quality, material investment, and focused market positioning.

Design decisions made early in development are what make a premium price point defensible at retail. Our post on design for manufacturability explains how to build quality and margin into a product from the first sketch, before any tooling investment is made. For common questions about cost and timeline, our FAQs page covers the most frequent questions we hear from founders in the early stages.

Section 3

What it actually takes to enter the toy and game market

The five things that trip up emerging brands

The five most common failure points are underestimating safety and compliance, ignoring retailer-specific requirements, separating design from engineering, skipping factory vetting, and misjudging tooling cost and lead time. Each one is dramatically cheaper to solve before production than after it.

The toy and game industry is one of the most regulated consumer product categories in the United States. That is not a reason to avoid it. It is a reason to understand it before you start spending money on design and tooling.

The brands that make it to retail and survive there have one thing in common: they treated compliance, design, and manufacturing as integrated work from the beginning, not as a checklist to complete at the end. The brands that do not make it usually made the same set of mistakes, in roughly the same order. Here is what those mistakes look like, and what to do instead.

1. Underestimating safety and compliance

The Consumer Product Safety Improvement Act (CPSIA) and ASTM F963, the Standard Consumer Safety Specification for Toy Safety, set the baseline federal requirements for toys sold in the United States. Those requirements cover mechanical and physical properties, flammability, chemical content (including lead, phthalates, and heavy metals), electrical safety for battery-operated toys, and age grading. Third-party testing through a CPSC-accepted laboratory is mandatory for children’s products, not optional.

On top of federal requirements, California’s Proposition 65 imposes additional chemical disclosure and warning requirements. Brands selling into international markets face EN 71 in Europe and equivalent standards in other regions. Retailers layer their own requirements on top of all of that.

The mistake most emerging brands make is treating compliance as a final-stage activity. They design the product, prototype it, and then send it to a lab. When the test results come back with failures, they discover that fixing the compliance issue requires redesigning a component, which means new tooling, which means both time and money they no longer have.

The right approach is to build compliance requirements into the design brief before a single sketch is drawn. Material choices, component sizes, finish types, and labeling requirements all need to be on the table at the beginning of the design process. This is one of the most concrete reasons why working with a team that has deep toy category experience from day one reduces development cost and timeline significantly.

20–40%Industry first-pass test failure rate for toy, game, and baby products, one of the highest of any consumer category
≤10%Klugonyx first-pass failure rate for toy, game, and baby product clients
<2%Klugonyx first-pass failure rate across other consumer product categories

The difference is attributable to compliance requirements being built into the design brief rather than reviewed at the end.

External resources: CPSC CPSIA requirements for children’s products; ASTM F963 Standard Consumer Safety Specification for Toy Safety.

We wrote a detailed guide to this in How to Make Safe Baby and Kids Products, which covers CPSIA, ASTM F963, Prop 65, and age grading in plain language. For the most common compliance questions we hear from first-time toy and baby product founders, our FAQs page is a good starting point. If you want to talk through what applies to your specific product before you have committed to a design direction, reach out to our team.

2. Ignoring retailer-specific requirements until it is too late

Federal compliance gets you into the legal minimum. It does not get you into Target.

Major retailers including Target, Walmart, Costco, and Amazon each maintain their own supplier compliance programs that go beyond regulatory minimums. These typically include factory audit certification requirements (BSCI, SEDEX SMETA, or equivalent), packaging specification compliance, product testing documentation in specific formats, and in some cases factory social compliance standards that require on-site audits conducted by approved third parties.

The timeline for meeting these requirements is longer than most founders expect. A factory audit can take weeks to schedule and complete. Corrective actions from an audit can take months to resolve. And retailers typically require documentation in advance of a buyer meeting or purchase order, not after.

The Smol case study in Section 4 illustrates this precisely. When Smol secured a retail partnership with Target, the compliance work required to meet Target’s factory standards was a project in itself. Having a manufacturing partner already embedded in that process meant the work could happen in parallel with production planning rather than delaying it.

Our manufacturing capabilities page covers how we manage factory audit and retail compliance across all major U.S. retail channels.

3. Separating design from engineering

The toy and game industry has a higher-than-average rate of products that look great in a prototype and fail in production. The reason is almost always the same: design and engineering were not talking to each other from the beginning.

A small part that functions perfectly in a hand-built prototype becomes an ASTM F963 choking hazard during third-party testing. A texture that looks beautiful in a CAD render requires a finish process that doubles unit cost at production scale. A mechanism that works in one material is impossible to achieve in the material needed to hit the target retail price.

None of these problems are unsolvable. All of them are significantly cheaper to solve at the sketch stage than at the tooling stage.

The practical implication is to require a manufacturing and engineering check-in at every stage of the design process, not just at hand-off. At Klugonyx, the design, engineering, and manufacturing teams work together from the first kick-off meeting. Manufacturing cost and compliance requirements inform concept decisions before any significant investment is made in a direction. That is what design for manufacturability means in practice, and it is the single biggest timeline and cost lever available to an emerging toy brand.

Our post on design for manufacturability goes deeper on how this works and why decisions made in the first two weeks of a project can either protect or destroy margin at production scale. For an overview of what our design process looks like end to end, see our design capabilities page.

A complete tech pack is what makes the factory handoff airtight. It documents every material choice, tolerance, color spec, and assembly instruction so nothing gets lost in translation. Our tech pack guide explains what goes in one and why incomplete documentation is the most common reason first factory runs fail.

What integrated DFM is worth

Based on Klugonyx project history, the integrated DFM process saves clients between $100,000 and $500,000 depending on product complexity, primarily by catching design issues before mold and tooling investment is committed. A single mold revision can cost $10,000 to $100,000 or more depending on the scope of the change.

Beyond direct cost avoidance, the process reduces development timelines by three to six months compared to sequential design-then-engineering workflows, cutting the number of sample iterations needed to reach a golden sample, particularly on first-time production runs of new products.

4. Factory vetting: the work most brands skip

Sourcing a toy factory is categorically different from sourcing a commodity manufacturer. You are sharing proprietary CAD files, tooling designs, and product specifications with a facility that may have relationships with your competitors, limited IP enforcement infrastructure, and a very different understanding of what a confidentiality agreement means.

The foundational protections are an NDA that is enforceable in the factory’s country of origin (not just signed as paperwork in yours), a legally binding factory agreement that covers cost, timeline, and quality standards, and tooling ownership documentation that establishes your ownership of any molds or dies produced for your product.

Beyond legal protections, a thorough factory vetting process covers production capacity relative to your order size, quality management systems including ISO certifications and in-process QC procedures, the factory’s existing client roster and product track record, physical facility inspection with documentation, and social compliance audit status (BSCI, SEDEX SMETA, or equivalent).

The 2026 tariff environment has made factory vetting and supply chain diversification more urgent than at any point since the first round of U.S.-China trade tensions in 2018 to 2019. With 77% of toys imported into the United States coming from China, elevated import tariffs have chilled production planning across the industry, with 87% of mid-size toy companies and 81% of small toy companies reporting delayed orders (The Toy Association, April 2025). For emerging brands sourcing from China, the immediate priority is to identify backup factory options in Vietnam, Cambodia, or Mexico before they are needed, not after a tariff escalation forces the issue under time pressure.

Our country-specific manufacturing guides walk through the trade-offs for each region: China, Vietnam, Mexico, and India are the four most relevant for toy and baby product brands. For a deeper look at supply chain diversification strategy, our post on transitioning manufacturing beyond China covers how to evaluate alternatives without disrupting your existing production.

The Smol case study in Section 4 illustrates exactly this scenario: when China tariffs rose, Klugonyx had already established a backup supply chain in Cambodia. That backup was not reactive. It was built during a stable period specifically to create optionality. Read the full Smol case study for the complete story.

Further resources on factory audit standards: QIMA factory audit and inspection methodology; Sedex SMETA audit framework documentation.

Within the broader Klugonyx factory network of 500-plus vetted partners worldwide, more than 250 specialize in toy and game manufacturing specifically, spanning food-grade silicone molders, plastic injection molders, soft goods factories, and electronic toy assemblers. That depth of category-specific supply chain access is what allows Klugonyx to match the right factory to the right product rather than routing every project to a general-purpose manufacturer.

5. Tooling investment: what nobody tells you before you start

Toy tooling typically runs $10,000 to $100,000 or more depending on complexity, and a production-grade mold takes six to twelve weeks to build and deliver from an overseas factory. Plan for at least one round of tool modification in both budget and timeline.

Injection-molded toy components require tooling, specifically steel or aluminum molds, before a single production unit can run. These tools are expensive, they take time to build, and they represent a capital commitment made before you have confirmed your first purchase order.

Product typeTypical tooling costNotes
Simple single-material silicone (teether, mat, sensory item)$2,000 to $10,000 per moldSimpler compression tools start around $800 to $4,000 (Jewelives, 2026)
Simple plastic injection molded component (ABS or PP)$5,000 to $25,000Single-cavity production-grade steel mold (Machinery Network, 2025)
Multi-component toy (three to five molds, moderate complexity)$15,000 to $75,000 totalTotal tooling investment across all required molds
Complex sets with tight tolerances, mechanisms, or electronics$50,000 to $100,000+A single complex multi-cavity steel mold can run $25,000 to $100,000+ on its own (Formlabs, 2025)

Klugonyx client experience aligns with this range: toy and game product tooling runs from approximately $10,000 to $100,000 or more depending on product complexity, materials, and the number of components required. The design decisions made before any tooling is committed are the single most powerful lever available for controlling this investment.

What emerging brands consistently underestimate is not just the cost of tooling but the lead time. A production-grade mold typically takes six to twelve weeks to build and deliver from an overseas factory. If the first samples come back with fit or function issues that require tool modification, that timeline extends. Planning for at least one round of tool modification in your timeline and budget is not pessimistic. It is realistic.

The other tooling consideration that affects product strategy is ownership. Tooling built by a factory is often treated by that factory as factory-owned unless your agreement explicitly states otherwise. Establishing clear written tooling ownership before production starts is non-negotiable.

Tooling ownership documentation is one of the core components of a well-structured tech pack. Our tech pack guide explains what this documentation should include and how to structure it before you engage a factory. For a full picture of what the engineering phase looks like, including how in-house 3D printing accelerates prototyping before tooling investment, see our engineering capabilities page.

The toy and game readiness checklist

Phase 1

Design and brief

  • Compliance requirements integrated into brief before first sketch
  • Age grading determined (0–3, 3+, 8+, 14+)
  • Material restrictions confirmed (lead, phthalates, BPA)
  • CPSIA scope assessed for children’s product designation
  • California Prop 65 noted for U.S. distribution *
  • ASTM F963 / EN 71 scope identified for target markets
  • Target retail channel requirements mapped to design *
Phase 2

Engineering and prototyping

  • ASTM F963 mechanical tests mapped to design decisions
  • EN 71 requirements confirmed for export destinations
  • Choking hazard assessment for all small parts
  • DFM review completed with manufacturing cost and compliance aligned
  • NDA executed and enforceable in factory’s country of origin
  • Tooling ownership documented in writing before factory engagement
  • Tech pack completed with full material, tolerance, and assembly specs
Phase 3

Sampling and testing

  • Third-party lab testing submitted via CPSC-accepted laboratory
  • ASTM F963 / EN 71 certifications received and reviewed
  • Golden sample approved and held by both brand and factory
  • QC checklist co-signed by factory team
  • Packaging compliance confirmed for age grading, warning labels, UPC
  • Prop 65 warnings verified for California distribution *
  • Pre-production inspection completed before full production run
Phase 4

Retail readiness

  • Factory audit completed (BSCI, SEDEX SMETA, or equivalent) *
  • Retailer compliance docs filed in correct format per buyer *
  • Testing certificates formatted per each retailer’s requirements *
  • Packaging artwork approved by buyer before production run
  • Final pre-shipment inspection completed and signed off
  • Logistics documentation confirmed for freight, customs, tariff class
  • Post-production QC review done before goods leave factory

* Requirements vary by retailer or target market. Confirm with each buyer. Sources: CPSC.gov, ASTM F963, The Toy Association, Klugonyx manufacturing experience.

Section 4

Case studies from the field

Four Klugonyx client stories, selected because they represent distinct entry points into the category: a first-time founder with a homemade prototype, an experienced team building a first sensory product line, a fast-growth startup that hit a scaling crisis, and an established brand augmenting its internal team.

The case studies that follow are drawn directly from Klugonyx’s published client work. Together, they illustrate the range of challenges emerging brands face and the common thread that connects successful outcomes.

Financial figures reflect what each client has made public. In each case, the qualitative outcomes, the product recognition, and the ongoing relationships speak to the results.

Case study 1: Busy Baby

Baby feeding and sensory play products · Design, engineering, manufacturing, ongoing product line expansion

Challenge
Beth, a U.S. military veteran and mother of two, needed to take a handmade suction-cup mat with tethers from homemade prototype to market-ready product. Every material decision was a safety decision: the silicone formulation had to meet FDA food-contact standards and CPSC requirements, hold suction across different high chair textures, and the tether system needed to withstand infant testing patterns without presenting entanglement or strangulation risk. There was no room for retrospective fixes once tooling was committed.
Solution
Klugonyx took responsibility for the full journey: design refinement from the homemade prototype through production-ready specification, engineering of the suction cup and tether systems, material qualification through FDA and CPSC compliance testing, factory sourcing and agreement, and ongoing manufacturing management. The founders’ role was to drive sales and build community. Klugonyx managed everything on the production side.
Outcome
Busy Baby appeared on Shark Tank in 2021. In four years from founding, the brand scaled from a startup with a handmade prototype to a multimillion-dollar business. Beth kept her in-house team lean and focused on sales while Klugonyx managed the supply chain.
“Klugonyx has held my hand through the entire process from initial design through manufacturing. They’ve supported me every step of the way to grow my product line to a seven-figure business.”Beth, Founder, Busy Baby

Busy Baby illustrates the lean team thesis more clearly than almost any other case in the Klugonyx portfolio. Beth did not hire a product designer, a mechanical engineer, a production manager, a quality specialist, and a logistics coordinator. She hired one partner that covered all of it. That operational model did not just save money. It gave her access to expertise she could not have hired individually at a stage when her company was not yet generating the revenue to support those salaries. Read the full Busy Baby case study.

Case study 2: Mobi Games / Zippee

Baby sensory toys · Design, engineering, manufacturing, 10-product line expansion

Challenge
The founding product, Zippee, emerged from watching an infant explore shoelaces. The real challenge was designing a multifunctional sensory toy from a single primary material (food-grade silicone) that met strict safety standards, engaged multiple senses, and remained manufacturable at target price. Without a strong design framework established early, the iteration cycle can add months and waste significant capital. The team also needed to validate developmental efficacy with doctors and therapists before committing to tooling.
Solution
Klugonyx’s design team led concept development in close collaboration with the Mobi founders and clinical advisors, translating developmental requirements into design criteria. The engineering team validated material specifications and resolved the geometric challenges involved in achieving the right grip tension and texture through molded silicone. Klugonyx’s existing experience with baby product materials and compliance requirements allowed the team to skip the dead-end iterations that consume months in a less experienced development process.
Outcome
Zippee launched in 2020 and won the ABC Kids Expo Best New Product Award that year. Klugonyx subsequently supported the design, engineering, and manufacturing of 10 additional sensory products in the Mobi line, helping the brand establish a defensible and growing product portfolio.

The Mobi case illustrates the cost of design framework failures better than almost any other example in the baby product category. The difference between a development process that establishes the right foundational decisions at the beginning and one that discovers problems at the prototyping stage is measured in months and in capital. Klugonyx’s ability to front-load the right expertise at the right moment is what made the timeline and outcome achievable. Ten follow-on products in the same line validate the relationship. Read the full Mobi Games case study.

Case study 3: Smol

Children’s active play and outdoor products · Manufacturing remediation, product line expansion, retail compliance, supply chain diversification

Challenge
Smol faced three sequential challenges after its indoor bounce house sold out in 24 hours at launch. First: the original factory could not scale, and rising defect rates put the young brand at risk. Second: a single-SKU brand needed to build a product line. Third: a Target retail partnership required factory compliance certification the brand was not yet equipped to meet. Each challenge traces back to decisions made before Klugonyx was involved.
Solution
Phase one: factory transfer and quality remediation, bringing defect rates down and restoring margin. Phase two: product expansion, including the outdoor water play table that became a best seller. Phase three: retail compliance management for Target supplier standards. Phase four: establishing a backup supply chain in Cambodia when China tariffs rose. That backup was built proactively during a stable period, not in response to a crisis.
Outcome
Defect rates reduced significantly. The outdoor water play table became a best seller. Target retail secured. Supply chain repositioned with meaningful tariff protection ahead of the 2026 tariff environment.

Smol is the most layered case study in this document because it shows what happens when the phases of product development and manufacturing are not integrated from the beginning, and what it takes to fix it. The original factory relationship, the quality problem, the compliance gap: all three trace back to decisions made before Klugonyx was involved. The cost of correcting them in time, capital, and brand risk was significant. The deeper lesson for emerging brands is not that Smol made avoidable mistakes. It is that every one of those problems has a predictable, preventable version that shows up early in the process rather than after the brand is already operational. The brands that build the right foundation at the beginning skip the remediation phase entirely. Read the full Smol case study.

Case study 4: MAGNA-TILES

Construction toys and children’s building sets · Concept design, character development, engineering, rapid 3D prototyping, production support

Challenge
MAGNA-TILES is an established brand with a loyal customer base and a clearly defined visual identity. Any new product development needed to feel authentically on-brand while expanding the product line in a meaningful direction. The Downhill Duo product required original character creation alongside the standard design and engineering process, characters that could credibly live within the MAGNA-TILES world and carry into future launches.
Solution
Klugonyx managed the full Downhill Duo development cycle: concept design, character development aligned with the MAGNA-TILES visual language, mechanical engineering, rapid 3D prototyping for iterative testing, and production support through manufacturing. The characters created during Downhill Duo proved strong enough that the MAGNA-TILES team carried them into additional product launches developed internally. Klugonyx also contributed early concept development for the Construction in Space product, shaping the initial direction before MAGNA-TILES completed it in-house.
Outcome
Downhill Duo launched as part of the MAGNA-TILES product line. The characters Klugonyx developed extended into additional MAGNA-TILES products, carrying value beyond the original project. MAGNA-TILES continues to engage Klugonyx as a design and engineering resource when supplemental support is needed, an ongoing relationship that reflects the trust built through the initial collaboration.

MAGNA-TILES represents the third archetype this document profiles: an established brand that uses an outside partner not to build from scratch but to augment their internal team at specific project stages. Klugonyx handled the full development cycle for Downhill Duo and contributed concept work on Construction in Space without needing to own the full project. For brands at this stage, the value is speed, specialized capability, and the flexibility to scale engagement up or down project by project.

Browse all of our toy, baby, and game product work in the Klugonyx project gallery.

Section 5

Resources for toy and game brands

The three trade shows that matter most for emerging U.S. toy brands are Toy Fair, ChiTAG, and ABC Kids Expo. The two organizations worth joining are The Toy Association and ASTRA. The CPSC-accepted testing labs most brands use are Intertek, Bureau Veritas, and SGS.

Getting your product right is only part of the job. Knowing where the industry gathers, who the influential organizations are, and what compliance infrastructure looks like will save you months of orientation time and help you build the right relationships before you need them.

We also recommend our Founder’s Field Notes podcast, which features conversations with founders across the toy, baby, and consumer product space, including several of the brands featured in this white paper.

Trade shows worth attending

ShowBest forLearn more
Toy Fair (The Toy Association)The industry’s primary annual U.S. event. Connects brands with buyers, licensors, media, and manufacturing partners. For emerging brands it is a temperature check on where the category is heading and what buyers want in the next buying cycle.toyassociation.org
Chicago Toy and Game Fair (ChiTAG)The inventor and emerging brand community. Dedicated inventor showcase, closely tied to the independent inventor ecosystem. Best for concept or early development stage feedback and licensing connections in a lower-stakes environment.chitag.com
ABC Kids ExpoBaby and juvenile category products. Buyers represent the full range of baby specialty and mass retail channels. The Mobi/Zippee Best New Product Award referenced in this paper was earned here.abckidsexpo.com

Industry organizations worth joining

The Toy Association

The Toy Association is the U.S. toy industry’s primary trade organization. Membership provides access to the ASTM F963 standard and compliance resources, Toy Fair exhibitor priority, industry data reports, government advocacy, and a network of industry professionals across retail, manufacturing, and design. For any brand serious about building in the U.S. toy market, Toy Association membership is not optional. It is the infrastructure. Learn more at toyassociation.org.

ASTRA (American Specialty Toy Retailing Association)

If specialty retail is any part of your channel strategy, ASTRA is the organization to know. It represents independent specialty toy retailers across the country and runs its own annual marketplace and academy event. Independent specialty retail is one of the fastest paths to initial distribution for brands that are not yet ready for mass retail compliance requirements.

Testing and compliance resources

Third-party testing for CPSC compliance and ASTM F963 certification is required for children’s products in the U.S. The major testing labs operating in this space include Intertek, Bureau Veritas, and SGS. Each operates testing facilities in Asia and the U.S. and can work with you on testing protocols before you commit to a final production run. The CPSC also publishes a complete list of accepted third-party testing laboratories on its website.

If you are unsure which compliance path applies to your specific product, our FAQs page covers the most common questions we hear from first-time founders entering regulated consumer product categories.

Section 6

How Klugonyx fits into this picture

Klugonyx is a full-service product design, engineering, and manufacturing partner based in West Valley City, Utah. Design, engineering, manufacturing, quality assurance, and logistics operate as one team on one workflow, which is what removes the handoff gaps where most toy and game projects lose time and money.

Every challenge described in this paper has a version that is significantly cheaper to solve before production than after it. Compliance gaps discovered at the testing stage require redesigns. Factory quality problems discovered after a launch require remediation and damage control. Tooling ownership disputes discovered after a factory relationship sours are expensive and time-consuming to resolve. Supply chain concentration discovered only when tariffs rise means scrambling for alternatives under time pressure rather than choosing from pre-vetted options.

The reason those problems occur when they do is almost always the same: the design, engineering, and manufacturing phases were separated, either by different vendors, different timelines, or different teams that were not talking to each other from the beginning.

Klugonyx is built around the opposite model. That integration is not a marketing claim. It is the practical reason why a homemade prototype becomes a Shark Tank brand in four years, why a sensory toy wins a Best New Product Award in the same year it launches, and why a brand that was bleeding through quality failures can turn around and land a Target deal.

What the team covers

CapabilityWhat it includes
Product designA three-phase process covering ideation and exploration, concept refinement, and concept finalization, with engineering and manufacturing check-ins built into every phase gate
EngineeringInitial CAD, prototyping, and CAD refinement, with DFM integrated from the first model and in-house 3D printing for rapid prototyping before tooling investment
ManufacturingA network of 500-plus vetted factory partners worldwide, with boots-on-the-ground oversight in Asia for production management, quality inspection, and issue resolution
Branding and packagingRetail presentation developed alongside the product, so packaging and product arrive at the same design decision-making table rather than sequentially
LogisticsFreight booking, customs and tariff management, and final delivery coordination, with supply chain diversification options built into every manufacturing relationship

Since founding, Klugonyx has designed, engineered, or manufactured approximately 1,000 toy and game SKUs, spanning baby sensory products, construction and building toys, outdoor and active play, tabletop games, and family products. Browse the full portfolio at klugonyx.com/projects/toy-games.


Conclusion

The U.S. toy and game market grew by more than $10 billion in real terms over the last 26 years. It survived the dot-com collapse, the 2008 financial crisis, a global pandemic, and a historic post-pandemic correction. In 2025 it delivered its strongest non-pandemic growth year in more than a decade. And it now sits approximately 35% above its 2019 baseline even as it navigates a complex tariff environment in 2026.

Inside that market, the fastest-growing segments are the ones being built by lean, focused brands with strong product design, the right operational foundation, and the flexibility to move faster than incumbents. The window is wide open. But it closes fast for brands that underestimate the operational requirements of the category.

The path in is navigable. The brands that do it right do not just survive the category. They define it.

If you are building something in the toy and game space, we should talk.


Frequently asked questions

How big is the U.S. toy and game market in 2026?

The U.S. toy and game market reached approximately $30 billion in 2025 on the tracked Circana series, up 6% year over year. That is roughly 35% above the 2019 pre-pandemic baseline. The central projection for 2026 is approximately +2% growth, with a range of -2% to +4% depending on how the tariff environment resolves through Q3 and Q4.

Is the toy industry actually growing, or is the 1.9% CAGR accurate?

Both, but the CAGR understates real growth. A 2012 NPD Group panel reset removed $4 to $5 billion of genuine sales from the tracked series by dropping retail channels without UPC-based systems and reclassifying several categories. Adjusting for that change, the market grew about $10.4 billion (roughly 58%) from 2000 to 2025 rather than the $7 billion (roughly 30%) the raw series shows.

What are the fastest-growing segments in the toy industry?

Four segments are outpacing the broad market: connected and IoT toys (forecast 24% global growth by 2030), sustainably made toys (13% global CAGR through 2032), plush and emotional wellness toys (6.1% CAGR through 2030), and tabletop and analog games, which grew 37% in 2025 to $4.9 billion and became the largest U.S. toy supercategory. Adult buyers, or “kidults,” now account for approximately 25% of all U.S. toy and game revenue.

What safety certifications does a toy need to be sold in the United States?

Children’s products sold in the U.S. must comply with the Consumer Product Safety Improvement Act (CPSIA) and ASTM F963, the Standard Consumer Safety Specification for Toy Safety. Third-party testing through a CPSC-accepted laboratory is mandatory, not optional. Requirements cover mechanical and physical properties, flammability, chemical content including lead and phthalates, electrical safety for battery-operated toys, and age grading. California’s Proposition 65 adds chemical disclosure requirements, and products sold in Europe must also meet EN 71.

How much does it cost to manufacture a toy?

Tooling is usually the largest upfront cost. A simple single-material silicone product runs $2,000 to $10,000 per mold. A simple plastic injection molded component in ABS or PP runs $5,000 to $25,000 for a single-cavity production-grade steel mold. Multi-component toys requiring three to five molds typically total $15,000 to $75,000, and complex sets with tight tolerances, mechanisms, or electronics regularly exceed $50,000 to $100,000. Klugonyx client experience aligns with a range of roughly $10,000 to $100,000-plus in total tooling depending on complexity.

How long does it take to bring a toy to market?

A production-grade mold alone typically takes six to twelve weeks to build and deliver from an overseas factory, and most first-time programs need at least one round of tool modification. Factory audits can take weeks to schedule and corrective actions can take months to close. An integrated design, engineering, and manufacturing workflow typically shortens the overall development timeline by three to six months compared with sequential design-then-engineering workflows.

What is design for manufacturability (DFM) and why does it matter for toys?

DFM is the practice of making design decisions with manufacturing cost, tooling method, material behavior, and compliance requirements factored in from the first sketch rather than reviewed at handoff. It matters in toys because compliance and cost problems discovered after tooling is committed require new molds, and a single mold revision can cost $10,000 to $100,000 or more. Based on Klugonyx project history, integrated DFM saves clients between $100,000 and $500,000 depending on product complexity.

Do I need my own factory to launch a toy brand?

No. Most emerging toy brands work with contract manufacturers. What matters more than owning a facility is vetting the one you use: an NDA enforceable in the factory’s country of origin, a binding factory agreement covering cost, timeline, and quality standards, written tooling ownership documentation, verified production capacity, ISO and in-process QC systems, and a current social compliance audit such as BSCI or SEDEX SMETA.

How are 2026 tariffs affecting toy manufacturing?

With 77% of toys imported into the United States coming from China, elevated import tariffs have chilled production planning across the industry. A Toy Association member survey found 87% of mid-size toy companies and 81% of small toy companies reporting delayed orders. A U.S.-China tariff pause in May 2026 provided partial relief, but downstream effects on production schedules and consumer pricing remain unresolved. The practical response is to identify and qualify backup factory options in Vietnam, Cambodia, or Mexico before they are needed.

Should an emerging toy brand compete on price or on design?

On design. Average selling price, not unit volume, is now the primary driver of brand health in toys. Premium products priced $30 to $69.99 grew 18% in 2025, and category ASP rose 4% after three flat years. The U.S. market average selling price was approximately $10.85 in 2024, while Klugonyx toy and game client products average $68.19 at retail. Small brands cannot out-manufacture the incumbents, but they can out-design them in a specific niche and build healthy margins without $20 million production budgets.

Let’s go

Building something in the toy and game space?

Tell us where you are, whether that is a sketch on a napkin, a prototype that needs to survive compliance testing, or a factory relationship that is not working. We will tell you what your path actually looks like.

Start a conversation

Austin MossBusiness Development [email protected] 801-649-7107
Noah AndersMarketing [email protected] 919-699-3365
KlugonyxWest Valley City, UT 84119 [email protected] (801) 997-5612